How to calculate Customer Lifetime Value (CLV): A complete guide
6 minute read
Customer Lifetime Value (CLV) continues to be the cornerstone metric for sustainable business growth, yet only 42% of companies can accurately measure it. This measurement gap represents a critical missed opportunity, especially when companies that actively monitor CLV report significantly higher sales performance.
Understanding how to calculate CLV accurately isn't just about number crunching—it's about unlocking insights that drive smarter resource allocation, improve customer retention strategies, and maximise long-term profitability. Here's your comprehensive guide to mastering CLV calculation and turning customer data into actionable business intelligence.
The key distinction lies in its forward-looking nature. Whilst traditional metrics measure what has happened, CLV predicts what will happen, enabling proactive decision-making around customer acquisition, retention, and resource allocation. This predictive capability makes CLV particularly valuable for subscription businesses, e-commerce platforms, and service-based companies with ongoing customer relationships.
Method 1: Historical CLV calculation
The simplest approach uses historical data to calculate what customers have already contributed. This method works well for businesses with consistent purchase patterns and provides a baseline for more advanced calculations.
The formula:
CLV = Average Purchase Value × Average Purchase Frequency × Average Customer Lifespan
Step-by-step calculation:
Calculate Average Purchase Value (APV): Divide total revenue by number of purchases over a set period.
Calculate Average Purchase Frequency (APF): Divide total purchases by number of unique customers.
Calculate Average Customer Lifespan: Determine how long customers typically remain active.
Multiply: APV × APF × Average Customer Lifespan.
Example: A coffee shop with $5 average purchase value, 400 annual visits per customer, and 5-year customer retention has a CLV of $10,000 per customer.
Best for: Businesses with stable purchase patterns and sufficient historical data. Ideal for retail, hospitality, and consumer goods companies.
Group Customers by Cohort: Common groupings include sign-up month, acquisition channel, or demographic characteristics.
Track Cohort Performance: Monitor revenue, retention, and engagement metrics for each cohort.
Calculate Cohort CLV: Apply historical or predictive methods to each cohort separately.
Compare and Analyse: Identify which cohorts generate highest lifetime value.
Example: E-commerce customers acquired in January 2024 show 20% higher CLV than those acquired in March 2024, indicating seasonal acquisition quality differences.
Best for: Businesses with diverse customer segments, seasonal patterns, or multiple acquisition channels.
2. Ignoring time value of money: Future revenue is worth less than present revenue. For long-term CLV calculations, apply appropriate discount rates to future cash flows.
Guide product development: Focus on features that increase customer lifetime value and retention.
Enhance customer experience: Invest in experiences that drive long-term loyalty and higher lifetime value.
How Pendula can help drive Customer Lifetime Value
Calculating CLV is only the beginning—the real value comes from acting on these insights through sophisticated customer engagement strategies. Pendula's platform transforms CLV calculations into actionable customer journeys that drive measurable results.
With Pendula's analytics capabilities, businesses can identify high-value customer segments early and create targeted engagement campaigns that nurture these relationships. The platform's AI-powered insights help see customer behaviour patterns, enabling proactive retention strategies before churn occurs.
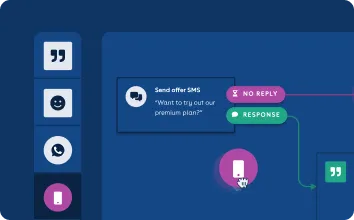
Pendula's visual workflow builder allows teams to create complex, personalised customer journeys based on CLV segments without requiring technical expertise. Whether you're nurturing high-value customers with premium experiences or re-engaging at-risk segments with targeted offers, Pendula provides the tools to turn CLV insights into profitable customer relationships.
Mastering CLV calculation is essential for modern business success, but it's not just about choosing the right formula—it's about selecting the method that aligns with your business model, data availability, and strategic objectives. Start with simpler historical methods to establish baselines, then advance to predictive modelling as your data and capabilities grow.
Remember that CLV is most powerful when combined with actionable customer engagement strategies. Use these calculations to inform smarter acquisition decisions, develop targeted retention programmes, and create customer experiences that drive long-term loyalty and profitability. The companies that master both CLV calculation and application will be the ones that thrive in tomorrow's competitive landscape.


.webp)


